How to use the AI Feedback Assistant
The guided overview highlights the main controls available in the AI Feedback Assistant. Use these controls to define which feedback the assistant should analyze, ask questions about your survey responses, and manage the generated output.
Permission set
When the AI Feedback Assistant is enabled on your account, make sure the right users have the permission to see and use it.
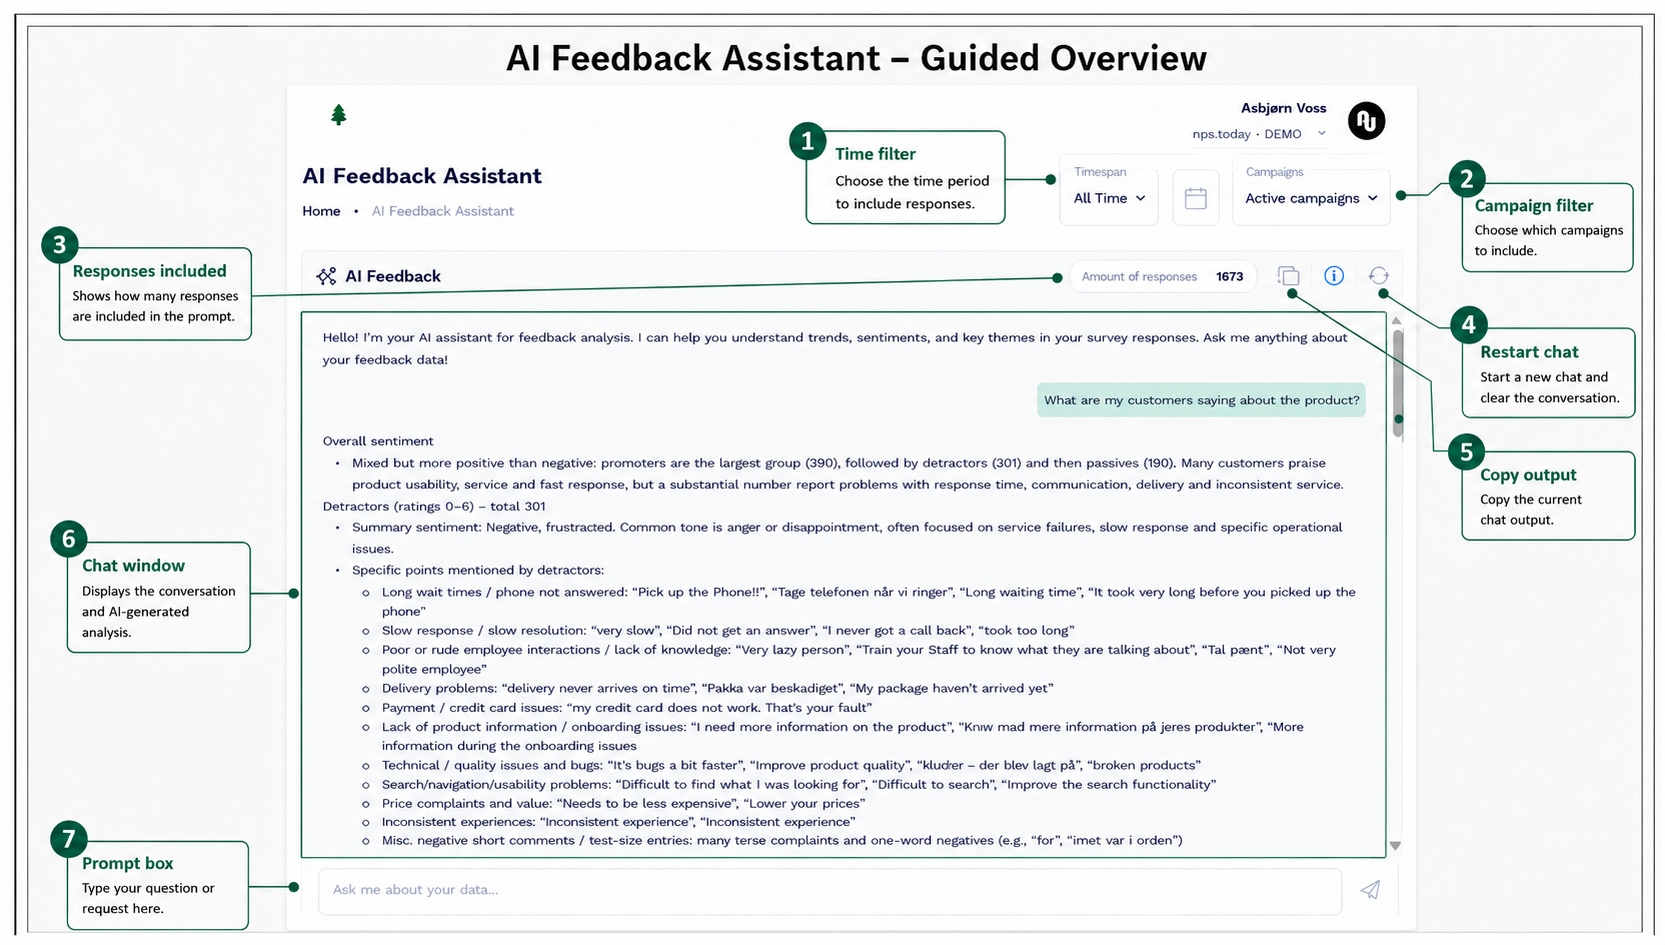
1. Time Filter
Use the Time filter to choose the response period the assistant should include in its analysis.
For example, you can focus the assistant on recent feedback or include a broader historical period. Changing the time span affects which survey responses are available for the assistant to summarize.
Use this filter when you want to analyze feedback from a specific period, such as the last month, quarter, year, or all available responses.
2. Campaign Filter
Use the Campaign filter to choose which campaigns should be included in the analysis.
This allows you to narrow the assistant's focus to feedback from specific campaigns instead of summarizing all available feedback. The selected campaigns determine which responses the assistant can use when generating answers.
Use this filter when you want to compare feedback from a specific campaign, exclude older campaigns, or focus only on currently active campaigns.
3. Responses Included
The Responses included indicator shows how many survey responses are included in the current prompt context.
This number changes based on the selected time span and campaign filters. It helps you confirm that the assistant is analyzing the expected amount of feedback before you ask a question.
A higher number of responses usually gives the assistant a broader data foundation, while a lower number may provide a more focused analysis.
Before asking a question
Check the number of responses included before you submit your prompt.
If the number is lower or higher than expected, adjust the time filter or campaign filter before asking the assistant to analyze the feedback.
4. Restart Chat
Use Restart chat to start a new conversation with the assistant.
Restarting the chat clears the current conversation and removes the previous chat context. This is useful when you want to begin a different task, start a new analysis, or avoid having earlier prompts influence the next answer.
Restarting the chat does not delete survey responses or change your account data. It only clears the current assistant conversation.
5. Copy Output
Use Copy output to copy the current AI-generated response.
This is useful when you want to reuse the summary in internal notes, reports, presentations, follow-up tasks, or customer experience planning.
Always review the copied output before using it in business decisions, customer communication, or reporting. AI-generated summaries should be treated as supporting insight and may require human validation.
6. Chat Window
The Chat window displays the conversation between you and the AI Feedback Assistant.
This is where you can read the assistant's analysis, review summaries, and continue working with the selected survey feedback. Longer answers may require scrolling inside the chat window.
The assistant's answers are based on the selected feedback data and the current conversation context.
7. Prompt Box
Use the Prompt box to ask questions, request an analysis, or instruct the assistant to create a specific output from the selected feedback.
You can begin with any relevant task. For example, you can ask for an overview, identify patterns, compare groups, investigate a specific issue, generate recommendations, or turn the findings into content for a report or presentation. The assistant uses the selected feedback and your instructions to determine how to respond.
You can then ask follow-up questions or give additional instructions to refine, expand, restructure, or reformat the result. This allows you to work iteratively with your feedback data and move from insight to action.
Example prompts include:
- Summarize the most important findings in the selected feedback.
- Identify the main positive and negative patterns.
- What issues appear to have the greatest impact on the customer experience?
- Compare the feedback from promoters, passives, and detractors.
- List the most common complaints and include supporting examples.
- Which customer needs or expectations are not being met?
- Recommend the three actions that should be prioritized based on this feedback.
- Create an executive summary suitable for a management report.
- Turn the findings into five bullet points for a presentation.
- Draft a follow-up action plan with suggested owners and next steps.
Example follow-up instructions include:
- Make the summary shorter and more action-oriented.
- Explain which findings are supported by the most responses.
- Show the differences between the selected campaigns.
- Organize the findings into service, product, price, and delivery.
- Add supporting customer comments for each finding.
- Rewrite the output for a senior management audience.
- Convert the recommendations into a table with priority, impact, and suggested action.
- Focus only on feedback from detractors.
Prompting best practice
Clearly describe the result you need and include any relevant format, audience, or level of detail.
For example, "Create a short executive summary with the three most important findings and recommended actions" will usually produce a more useful result than "Summarize the feedback."
Creating Charts
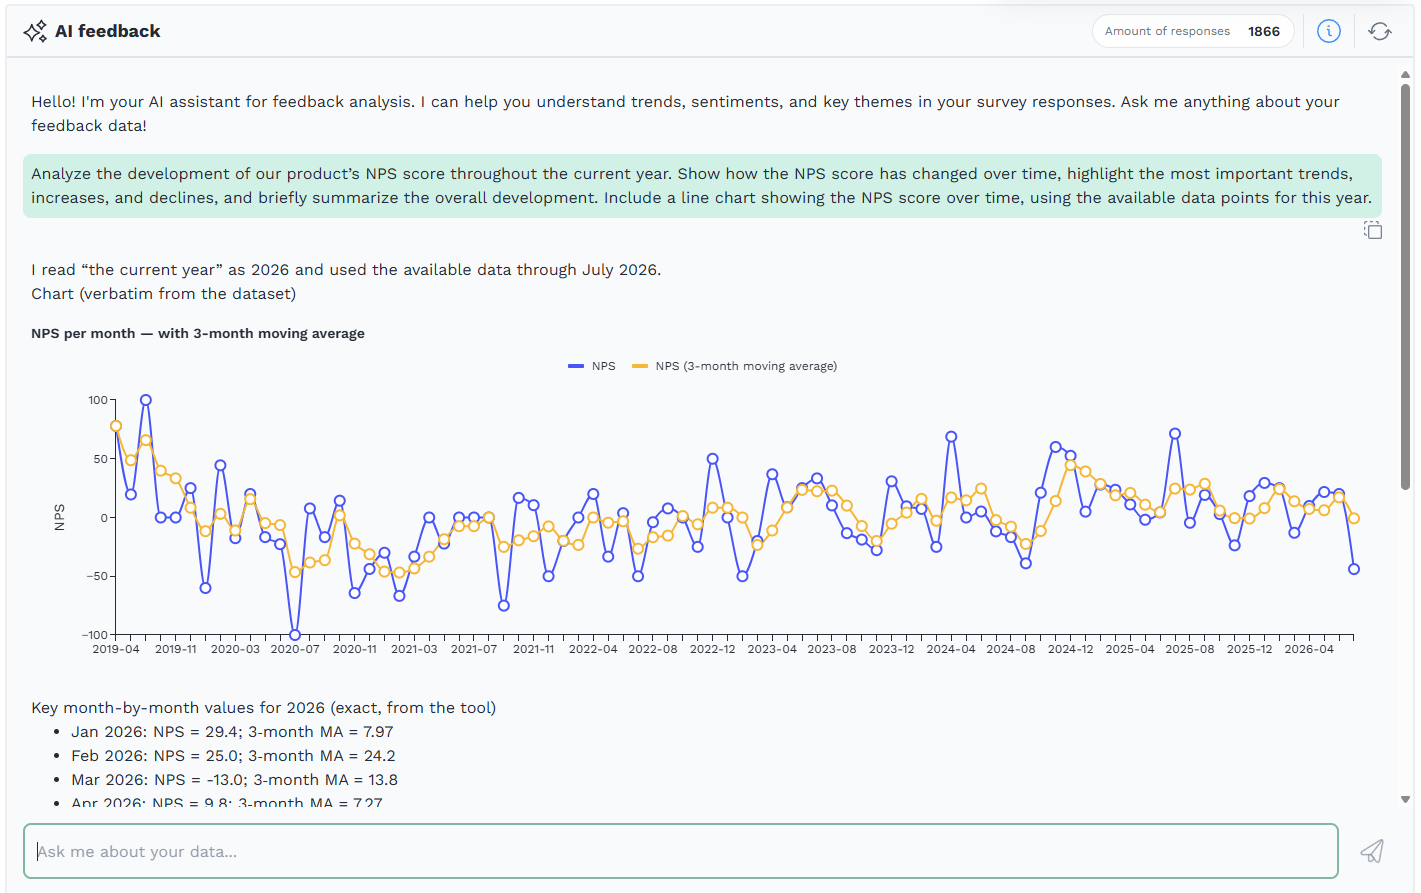
The assistant can also visualize the selected feedback. Ask for a chart in the prompt box, and the assistant generates it directly in the chat window based on the responses included in the current context.
The assistant supports three chart types:
| Chart type | Best used for |
|---|---|
| Line chart | Development over time, such as score trends across months or quarters. |
| Bar chart | Comparing values across categories, such as themes, or respondent groups. |
| Pie chart | Showing distribution, such as the share of promoters, passives, and detractors. |
Chart types are limited
Only bar charts, pie charts, and line charts are available. The assistant cannot produce other visualizations, such as scatter plots, heatmaps, or gauge charts.
Example chart prompts include:
- Show the development in our score over the current year as a line chart.
- Create a bar chart comparing the most common themes in the feedback.
- Show the distribution of promoters, passives, and detractors as a pie chart.
- Visualize the number of responses per campaign in a bar chart.
Getting the chart you want
Name the chart type, the values, and the grouping directly in the prompt — for example, "Include a line chart showing the score per month for this year."
If the chart is not what you expected, you can ask a follow-up such as "Show the same data as a bar chart instead" or "Group the data by quarter instead of month."
Chart example
In the example below, the assistant was asked to analyze the development in the score across the current year, highlight the most important trends, and include a line chart based on the available data points.
Always review the numbers
Charts are generated from the responses included in the current context. Check the time filter, campaign filter, and responses included before you reuse a chart in reporting.
Recommended Workflow
- Select the relevant time period.
- Select the relevant campaigns.
- Check the number of responses included.
- Enter your question, task, or instruction in the prompt box.
- Review the answer in the chat window.
- Use follow-up instructions to refine or expand the result.
- Ask for a chart if you want the findings visualized.
- Use copy output if you want to reuse the answer.
- Use restart chat when you want to begin a new conversation.